
Use reports and analytics to get insights about your campaigns and optimize engagement and conversions. This article describes how to use it.
What information is available
The information below is available in Up’s reports:
- Sents
- Opens
- Clicks
- Unsubscribes
- Bounces
This information can be seen:
- Per campaign or group of campaigns
- Filtered in a specific period of time
- Per email template
How to read reports
First, go to the Reports tab.
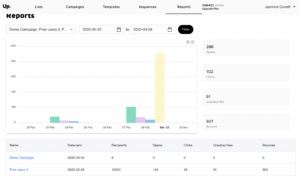
On the top of the page, there is a high-level bar chart. Each bar represents one of the metrics (sent, open, click, bounce, unsubscribe) on a given day.
There are 2 filters on the top: a date filter and a campaigns filter. By default, the 7 last days will be selected, and all campaigns will be selected. You can then filter the information according to what insights you need.
Related Post: Setup SPF and DKIM for Amazon SES
Clicking on each metric on the right side will also filter that specific metric in or out of the chart:
At the bottom of the page, there is a table with more details on each individual campaign. This means you can view the performance of all your campaigns together on the top, and dig into more detailed information at the bottom if you need to. The table will bring the same information about each campaign: emails sent, opens, clicks, unsubscribed, and bounces.
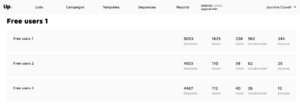
If you need to dig into even more detail, just click on the name of a campaign. This will take you to another page with information about each specific email template. This way, you can compare which email templates are performing the best, and optimize your campaigns based on that. For example, the campaign “Free Users 1” below is comprised of 3 email templates: “Free users 1”, “Free users 2” and “Free users 3”.
Next Steps
You are all set with Amazon SES and Up to start sending and monitoring amazing email campaigns! Still need help with anything? Drop us a message at contact@replyup.com.